Usage
See how your workspace spends its credits by person, team, model and feature over any period, and what you see when you can only view your own usage.
Settings → Workspace → Usage reports how credits were spent, on what and by whom, and how long the balance will last. You can also open it from "Usage" in the Credits popover at the foot of the sidebar.
Everyone can open this page. With "View workspace activity and governance" (Admin by default) it covers the whole workspace. Without it, a fixed Person: You filter limits it to your own usage. See Roles and permissions.
Choose a period and filters
- Period: Last 7 days, Last 30 days (default), Last 90 days, This cycle, Previous cycle, or a custom range. The arrows step through earlier billing cycles.
- Filters: Model and Feature; with workspace access, also Person and Team. Panels that can't be filtered that way are hidden.
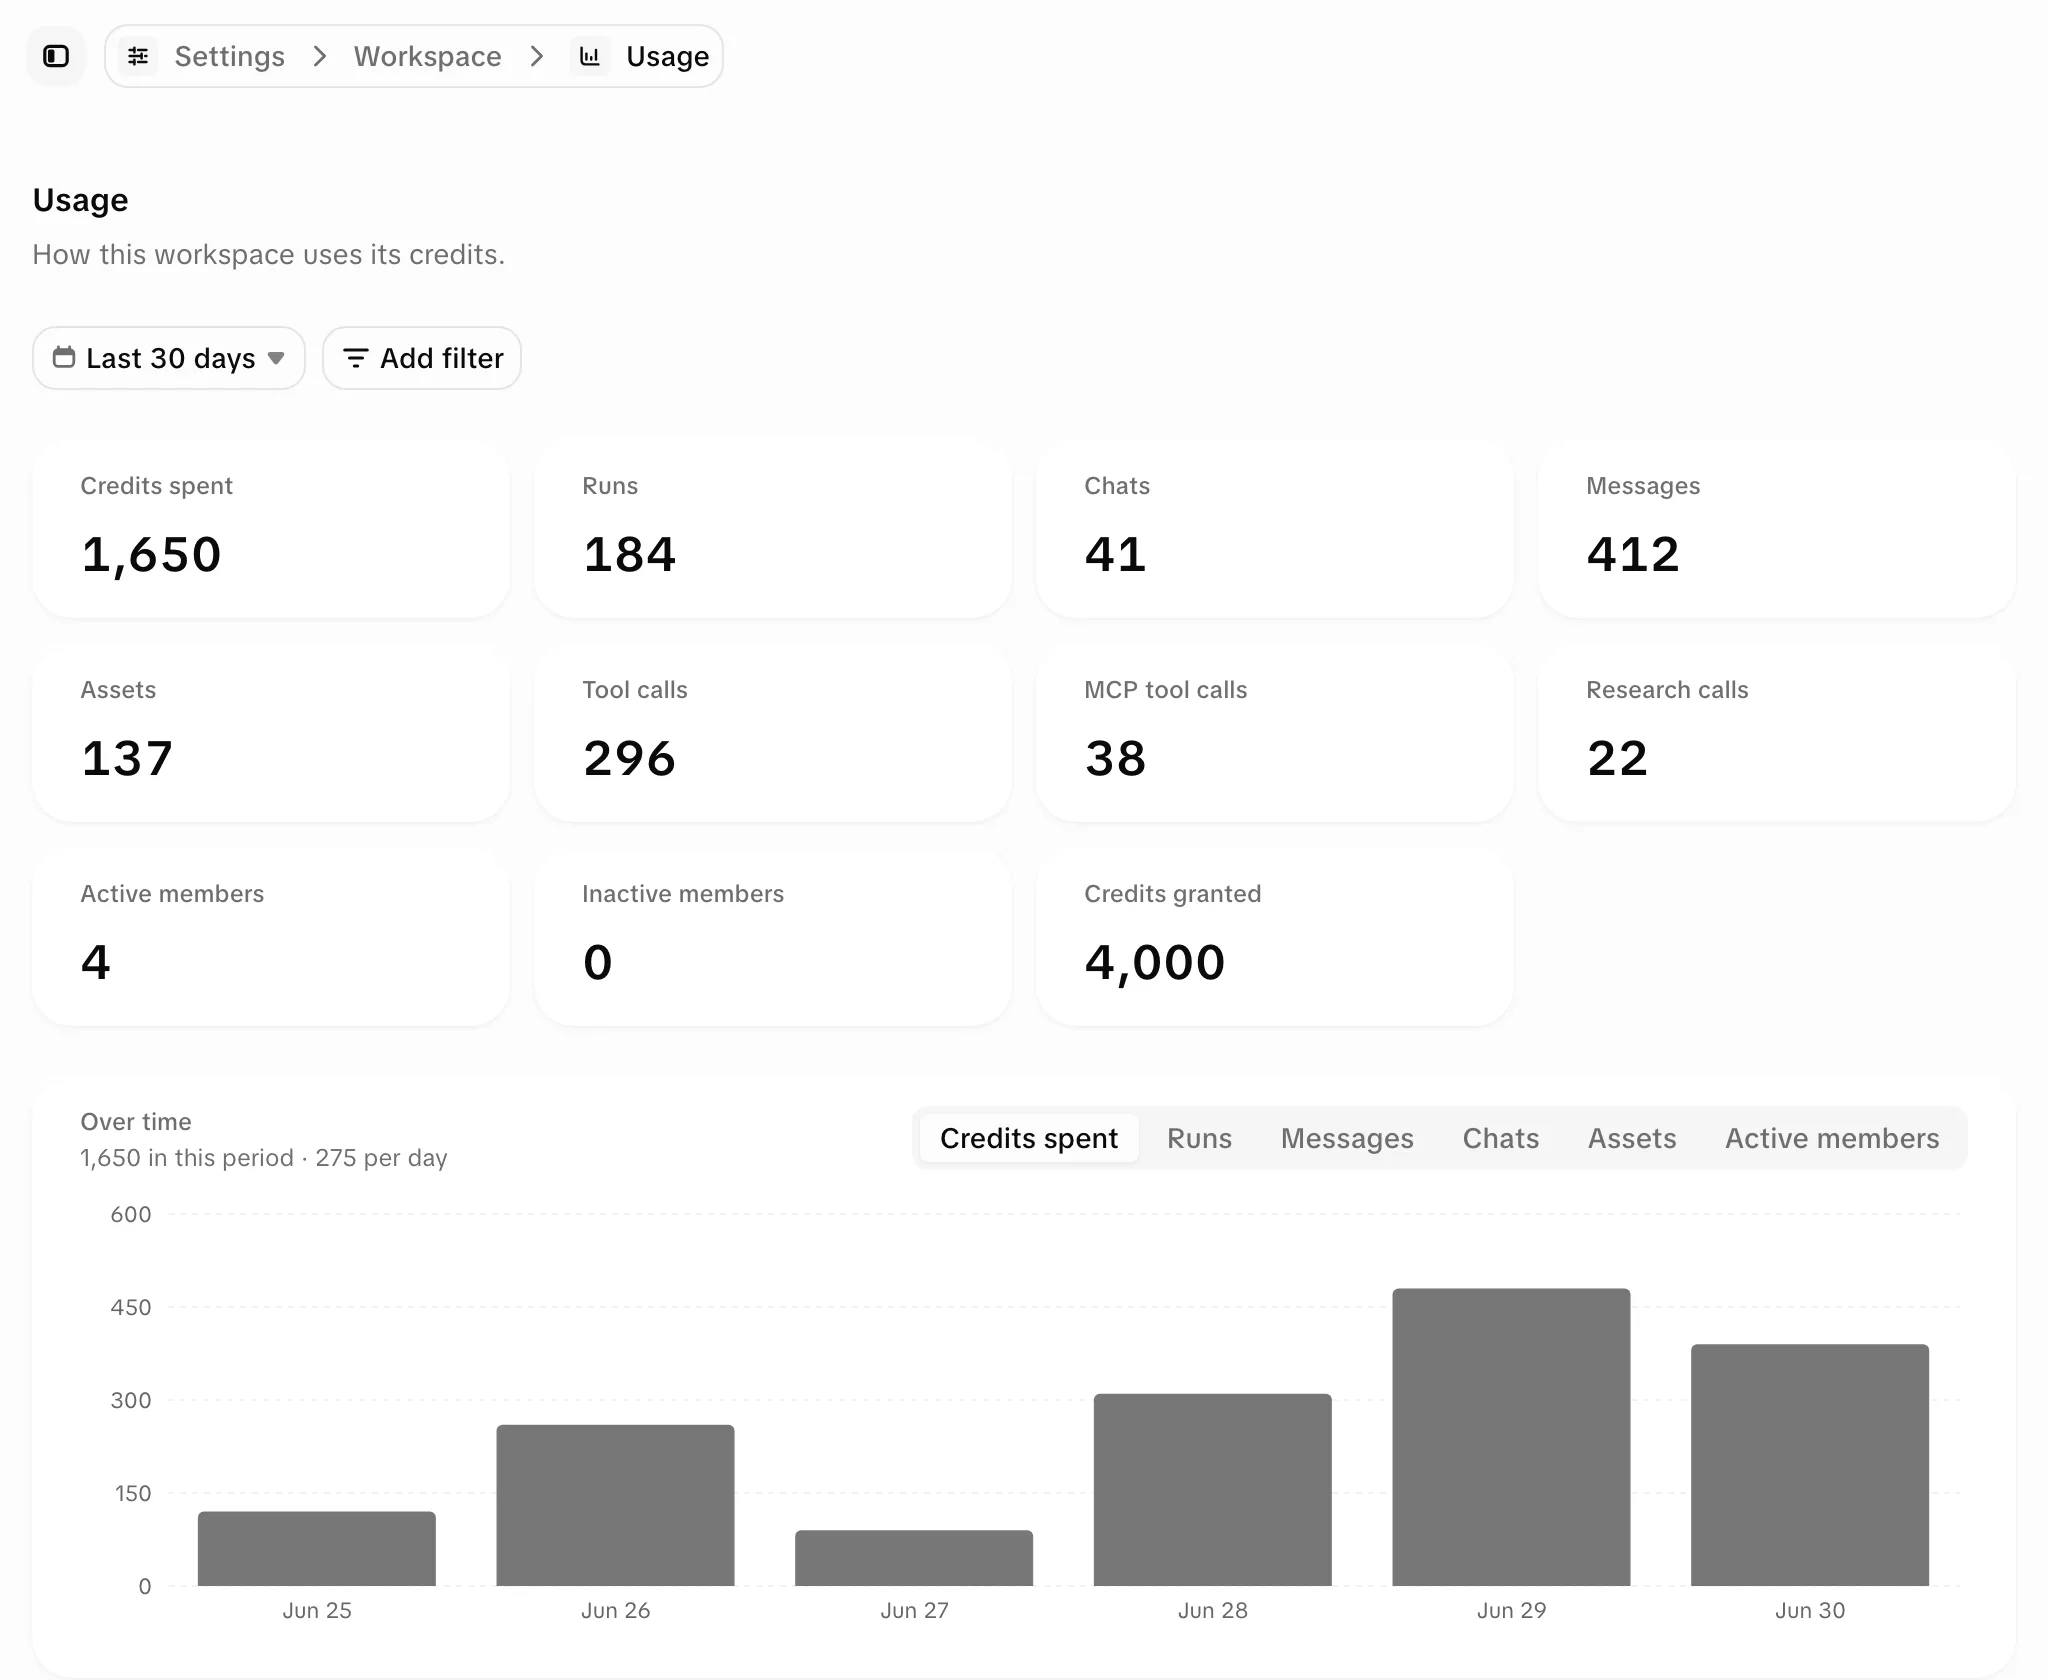
What the report shows
| Panel | Contents |
|---|---|
| Totals | Credits spent, runs, chats, messages, assets, tool calls, MCP tool calls, research calls. Workspace view adds active and inactive members and credits granted. |
| Over time | One metric per day across the period. |
| Balance and runway | Credits available, when they run out at the current pace, the daily budget until renewal, and each credit bucket with its expiry. Whole workspace, no filters only. |
| Breakdowns | Credits by feature, channel (chat, app or MCP) and model; runs by model and output type; assets by source and type. |
| Rankings | Workspace view only: top members, inactive members, spend by team. |
| Resources | Current people, projects, canvases, skills, connectors, scheduled tasks, and seats in use. |
Select a person in a ranking to open their profile, whose Usage tab shows the same report for them only.
Related pages
- What was charged to the card: Billing.
- Each individual event: Activity.
- Spending caps: Teams and limits and Credits and spending.